Clinic.js
Clinic.js is a suite of performance profiling tools that help developers diagnose and pinpoint performance bottlenecks in Node.js applications.
Autocannon
Autocannon is a fast HTTP/1.1 benchmarking tool that runs within Node.js. It's primarily used for load testing HTTP servers.
Parameters Explanation
Clinic
- -on-port: This is used to specify a command that Clinic should run once the target Node process starts listening to a port.
Autocannon
url: Target URL.
connections: Number of concurrent connections. Multiple connections can simulate multiple users or clients.
duration: Duration of the test in seconds.
amount: Total number of requests throughout the test.
requests: An array of request objects which can help in customizing requests.
Examples
clinic flame --on-port 'ts-node script.test.ts' -- node dist/index.jsCommon Pitfalls and Solutions
- Environment Variables: Ensure that environment variables are set correctly. One common mistake is forgetting to pass the environment variables when starting the load test. Use
myEnv=stagingor the appropriate environment setting before thecliniccommand. - Async/Await with Autocannon: When running asynchronous code before invoking
autocannon, ensure that you await the results, especially when setting up test data. If not,autocannonmight start before your async operation completes. - Understanding
connectionsin Autocannon: Theconnectionsparameter determines how many concurrent connections should be open during the test. If you set it too high compared to theamount, you might end up with multiple connections executing the same request, leading to duplicated requests. - Dynamic Request Generation: If you need to send different data with each request, generate an array of request objects and pass it to the
requestsparameter in Autocannon.
Detailed Example: Load Testing with Autocannon
Here's a comprehensive example that showcases how to use autocannon for load testing with dynamic request generation:
( async () => {
    const testData = await generateTestData();

    for ( let i = 0; i < 500; i++ ) {
        requestBodies.push( generateRequestBody( testData ) );
    }

    const autocannonRequests = requestBodies.map( body => ( {
        method: 'POST' as const
        , headers: { 'content-type': 'application/json' }
        , path: '/hasura-events'
        , body: JSON.stringify( body )
    } ) );

    const instance = autocannon( {
        title: 'Hasura Event Load Test'
        , url: 'http://localhost:3025'
        , connections: 1
        , duration: 10
        , amount: autocannonRequests.length
        , requests: autocannonRequests
    }, ( err, results ) => {
        console.error( err, results );
    } );
    instance.on( 'start', () => console.log( 'Load test started' ) );
    instance.on( 'done', () => console.log( 'Load test done' ) );
} )();
Explanation:
- Generating Test Data: Before starting the load test, we generate test data using the
generateTestDatafunction. This data will be used to populate the request bodies for the load test. - Creating Request Bodies: We loop 500 times, each time generating a new request body using the
generateRequestBodyfunction. These request bodies are stored in therequestBodiesarray. - Mapping to Autocannon Requests: The
requestBodiesarray is then mapped to the format required byautocannon. Each request is set up to be aPOSTrequest targeting the/hasura-eventspath. - Setting Up and Running Autocannon: We set up and run
autocannonwith specific configurations:- The title of this test is "Hasura Event Load Test".
- The target URL is
http://localhost:3025. - We are using a single connection (
connections: 1) which means requests are made one after the other, not concurrently. - The duration of the test is set to 10 seconds.
- The total number of requests (
amount) is equal to the length of theautocannonRequestsarray. - The requests to be fired are provided in the
requestsproperty.
- Event Listeners: We also attach event listeners to the
autocannoninstance to log messages when the load test starts and completes.
Autocannon Output
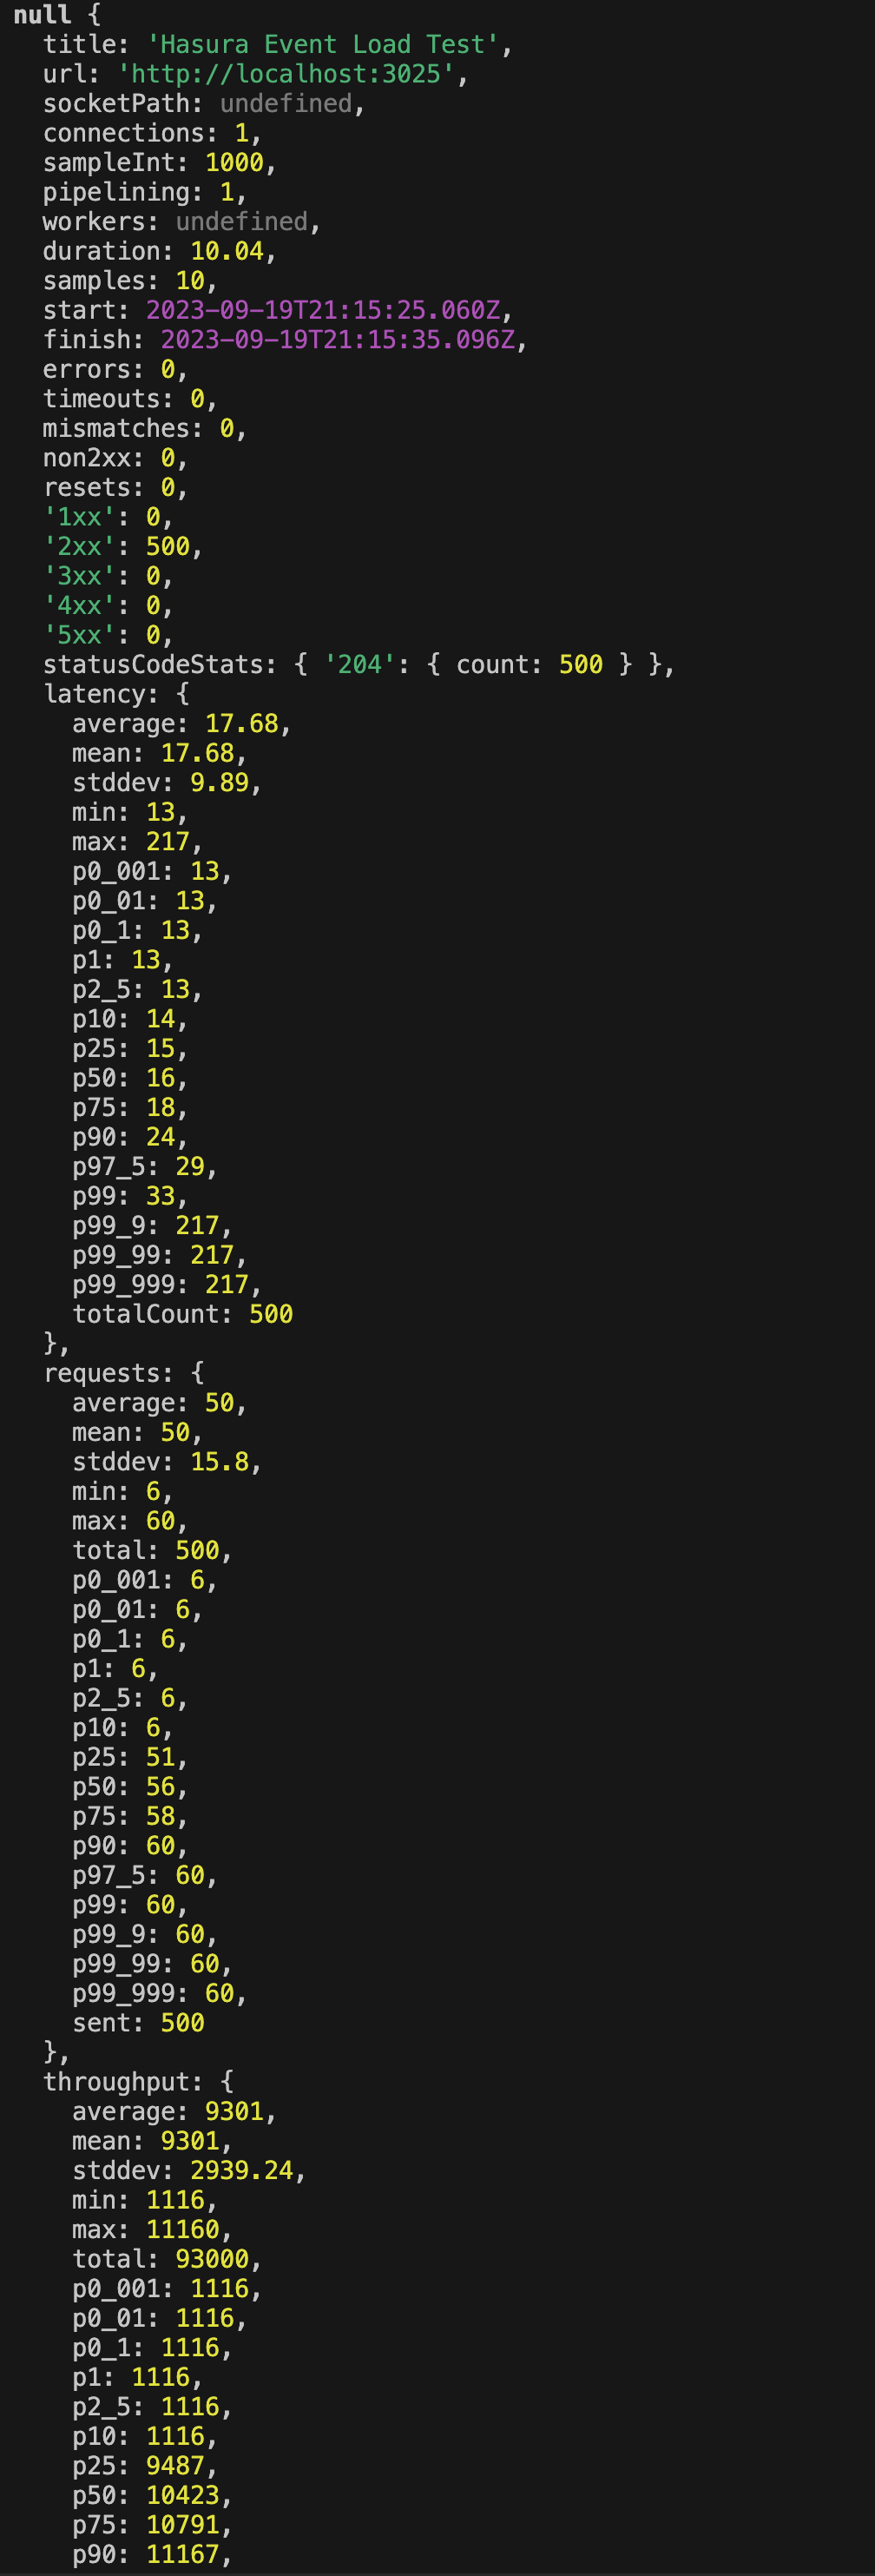
Autocannon Output Analysis:
- General Information:
title: The name of the load test, which is "Hasura Event Load Test".url: The target URL of the load test,http://localhost:3025.connections: Number of concurrent connections. Set to 1, which means requests are made sequentially.duration: The duration of the test in seconds, which is just over 10 seconds in this case.start&finish: The start and finish timestamps of the load test.
- Response Status Codes:
errors: Number of request errors. 0 in this case, which is good.timeouts: Number of timed-out requests. 0 is good.non2xx: Number of responses with status codes outside the 2xx range.'1xx'to'5xx': These show counts of responses with different status codes. Here, we have 500 successful 2xx responses, specifically 204 No Content responses.
- Latency:
average&mean: Average latency of the requests in milliseconds.stddev: Standard deviation of the latency.min&max: Minimum and maximum latency observed.pX: Percentile values. For instance,p99means that 99% of the requests had a latency below the given value.
- Requests:
average&mean: Average number of requests per second.stddev: Standard deviation of the number of requests per second.total: Total number of requests made during the test.sent: Total number of requests sent.
- Throughput:
average&mean: Average number of bytes sent per second.stddev: Standard deviation of the bytes sent per second.total: Total bytes sent during the test.
The percentiles (like p99, p50, etc.) are especially useful when analyzing performance. For instance, p99 latency being significantly higher than the average might indicate occasional spikes in response times.
From this report, it seems the server responds pretty swiftly for the most part, with an average latency of around 17.68ms. There's an occasional spike as indicated by the max latency of 217ms and the p99.9 percentile.
The throughput and requests per second also provide insights into the server's capability to handle traffic. Given that the server can handle 50 requests per second with the given setup, we can infer its capacity in more demanding scenarios.
Overall, this report provides a comprehensive overview of how the server performs under the defined load, and can be used to identify potential bottlenecks or areas of optimization.
Clinic Output
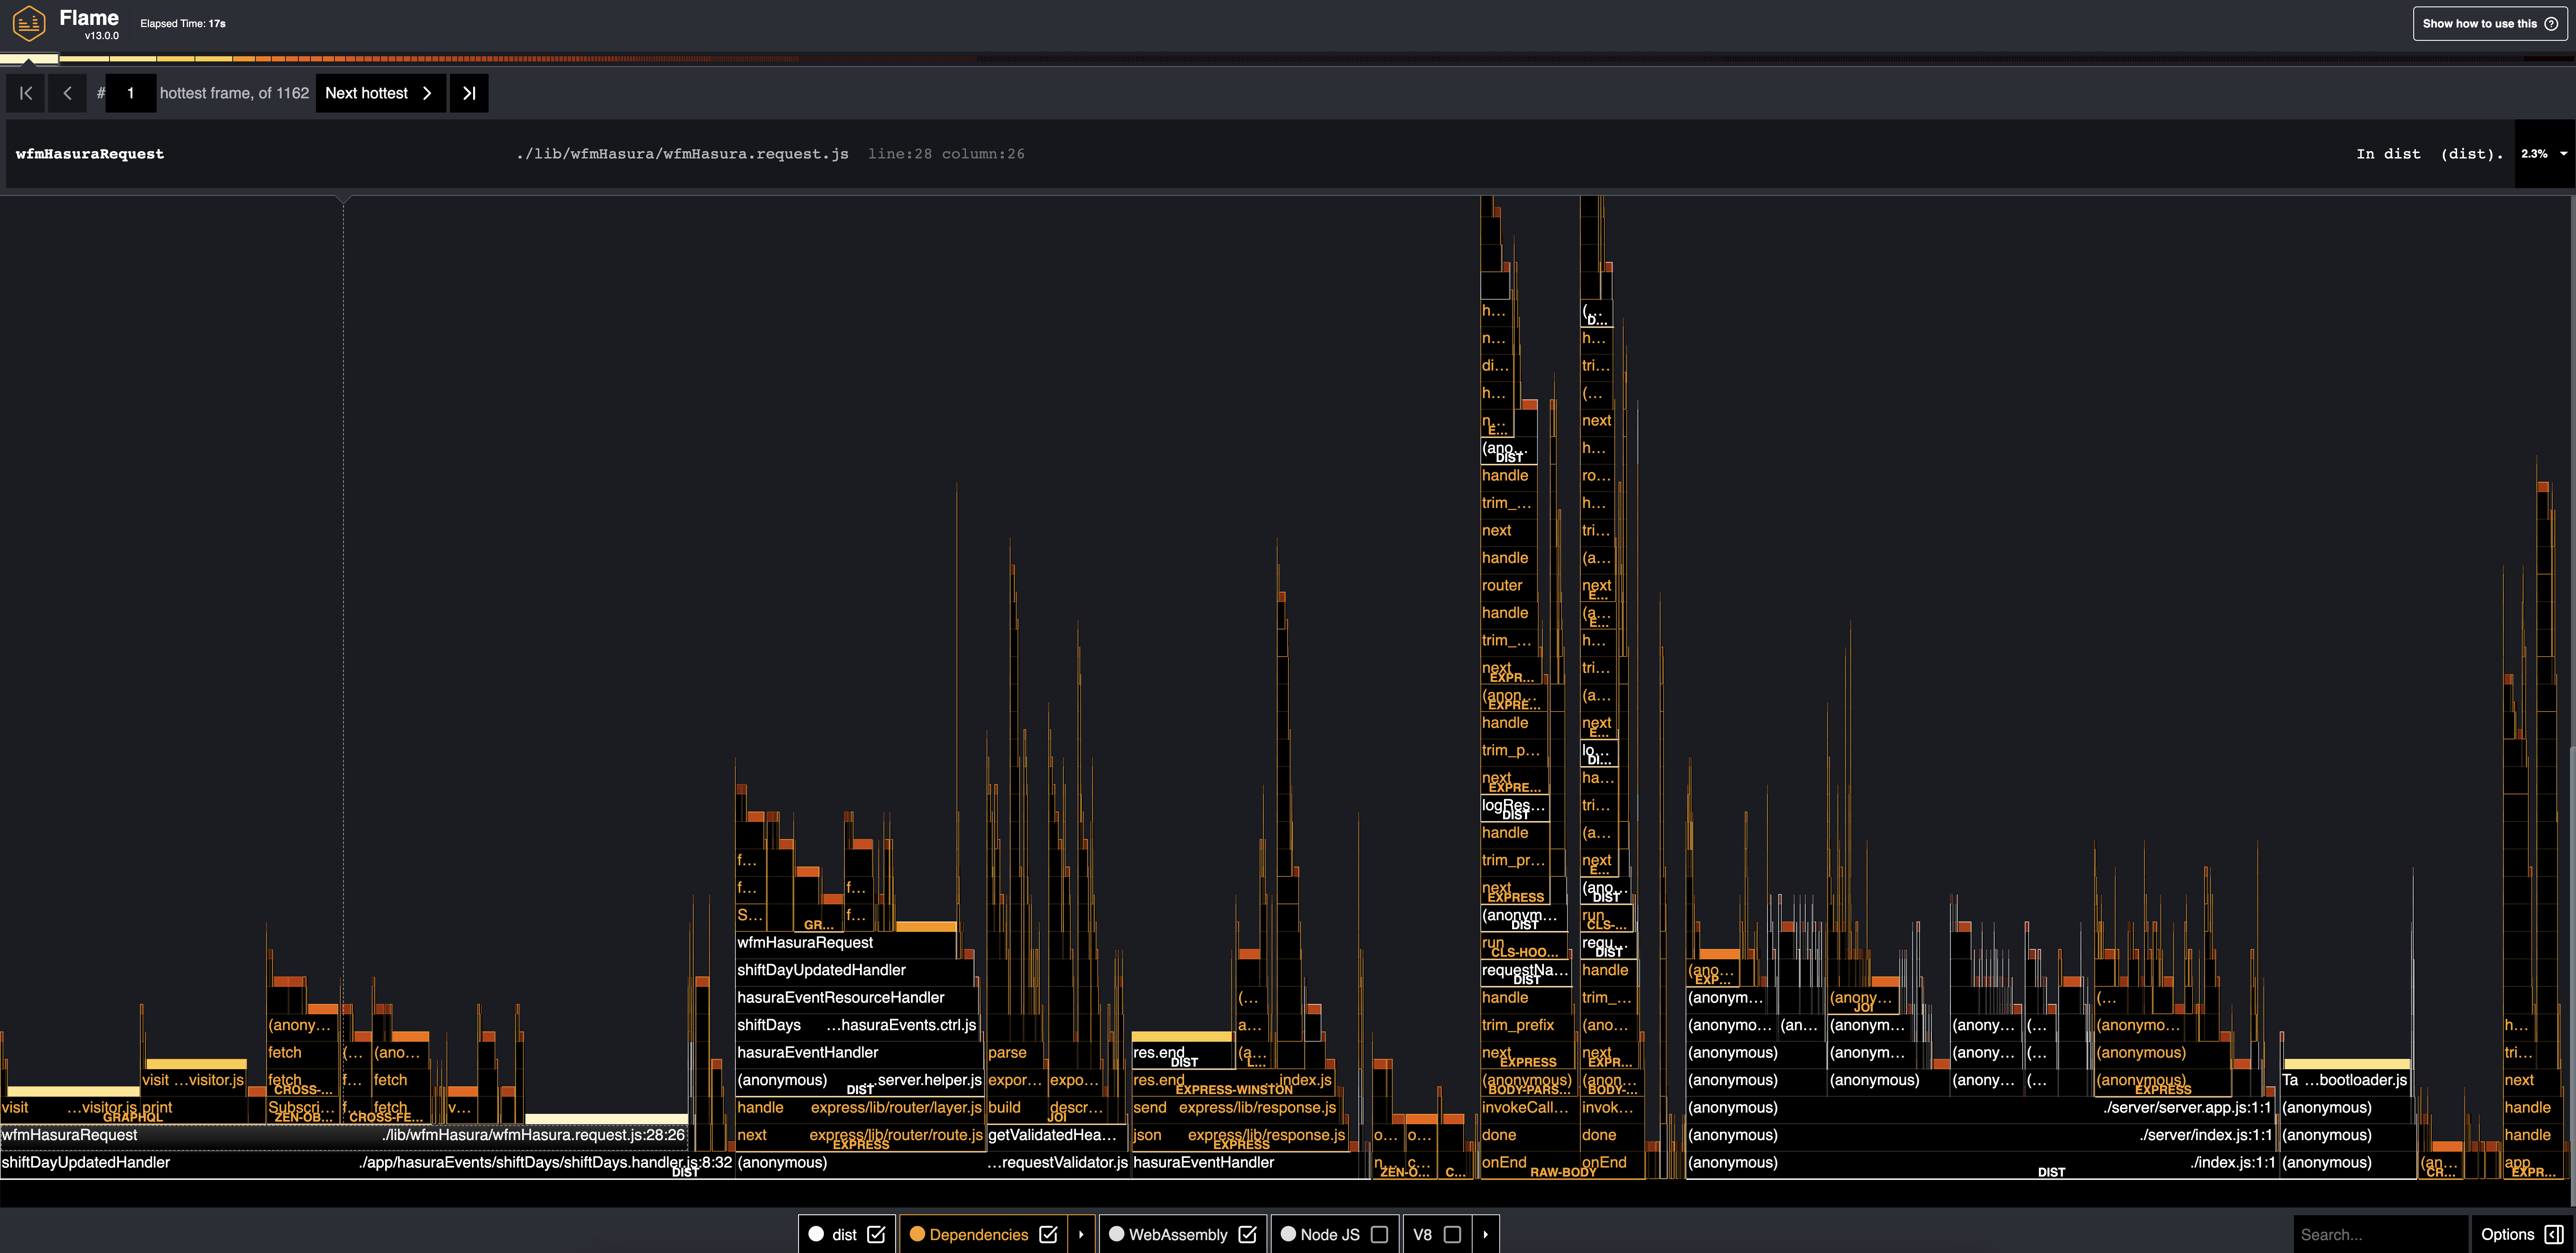

Flamegraph Analysis:
- wfmHasuraRequest: The function consuming the most CPU time. Given its role in making requests to Hasura, this function's time consumption might involve sending the request, processing the response, and any internal processing.
- shiftDayUpdatedHandler: This function is seen as a parent of
wfmHasuraRequestin the flamegraph, indicating thatwfmHasuraRequestis called from withinshiftDayUpdatedHandler.
Conclusion
Both Clinic and Autocannon are powerful tools in the Node.js ecosystem for performance profiling and load testing, respectively. When combined, they provide a robust way to ensure our application can handle the desired load and help pinpoint any performance issues.